Tuesday, March 20, 2012
The Orphan Categories: Saves
As I start to get into level 3 draft preparation, I have been parsing which rounds to target which guys with an eye to having a team that will be able to put up good numbers in each one of the 12 categories. To aid me in this pursuit, I have looked at who is projected to put up the best numbers in each category and when these players are being drafted. Two trends have started to make their presence known: the independence of steals and the differential calculus of relievers.
Looking at relievers in particular: the guys who come up as the tops in the categories are noticeably lower in overall ranking than their more potent position-mates. This is not as much of a surprise with closers than with speed guys, but it still makes you scratch your head. The top 5 relivers are Craig Kimbrel, Mariano Rivera, Jonathan Papelbon, John Axford, and Drew Storen. The highest amoung them is Craig Kimbrel at in the 6th round, Mo and Papelbon in the 8th, and then the rest after the 10th. Compare that with the top 5 starters, Justin Verlander, Clayton Kershaw, Roy Halladay, Cliff Lee, and Felix Hernandez who are all going in the first 3 rounds. Of course, these guys will pitch fewer innings and so will be able to contribute less to the pitching staff than starters, but let us consider the implications of that for a second: is a good closer really worth so much less than a starter? What about 2? Perhaps 3? The top closer, Craig Kimbrel, is projected to put up a line of 108 Ks, an ERA of 2.29, and a WHIP of 1.11. Good numbers, to be sure, but only accrued in 71 IP. Compare these numbers to a single elite starter, Cliff Lee for example, who will have 204 Ks, an ERA of 2.89, and a WHIP of 1.07 over more than 3 times those innings, 221 IP. Looking at those two together gives a better idea of how little the reliever would contribute: if you had both of them together, the joint ERA would drop only 0.15 from Lee's 2.89 for a 2.74 ERA, and the K/9 would rise from Lee's 8.31 to 9.62, a far cry from Kimbrel's 13.69. It would take the top three closers to have an equal effect as a single elite starer. Craig Kimbrel, Mariano Rivera, and Jonathan Papelbon are together projected to have 240 Ks, an ERA of 2.49 and WHIP of 1.067 in a total of 195 IP. Indeed, it is clear that closers can contribute pretty exclusively to saves, and you must rely on your starters for the rest of the categories.
Saturday, February 18, 2012
The Draft Man Cometh Part 1
The Draft.
My heart enters into that elevated and erratic pitter patter that would put less fit people in the hospital. My too-close-together eyes dilate as if thrown into blinding sunlight from a dark lair. My blood boils into my wang like that Typhoon that wiped Japan off the map a year ago.
The Draft.
The hours spent preparing, the petaflops spent calculating, the photons generated deep inside Sol travelling through the vacuum of space to hit printed words in Fantasy Baseball magazines and then be deposited into my rods or cones. All wasted when Lenny Dykstra picks Miguel Cabrera 4th and my entire strategy is thrown into disarray.
The Draft.
120 seconds stretches out to infinity as all sounds die away and my world distills down to myself, my computer screen, and a long list of players. Hunter Pence? Brandon Phillips? I could get a top-line starter here. If I don't take a second baseman now, I will have to get someone at the bottom of the barrel. Ichiro will get hits and steals, but without the Ding-a-lings, how can I make up RBIs and OPS? Bill James predicts a big year from Joseph Bats, but that hack comedy writer Matthew Berry doesn't buy in; who to trust! I love numbers but yet Berry has a podcast! What does that mean! What does any of it mean! The timer begins to beep and what had been an eternity is now but 4 seconds. Ichiro? Phillips? Bats? Rios? Help me Jebus! "Jayson Werth!" I hear a disembodied voice call out. And just like that, my fantasy season is destroyed.
The Draft.
But wait a minute here, what does the draft really mean? The year that my beloved Ackbars strode easily to victory, my first pick was solid, but my next 4 were pretty much garbagio. Other than Woo Woo, we pretty much all make our hay on the free agent wire; the drafted players do yeoman work, but they are rarely the decisive factor. Is the draft pointless? Does draft position have anything to do with how strong a player will be after all accounts have been closed? Unclear. Let's take a look at some hard data and see if we can draw any conclusions.
I looked back at the drafts from the past 3 years and then pulled out the ESPN power rankings of the top 500 players for these years as they stood at the end of the year. If a player finished outside of the top 500 for that year, he got a power ranking of 500. All keepers have been excluded in this analysis. Before you look below, think about what you would expect: The guys at the beginning of the draft would be the highest rated at the end of the year, so you would expect pretty much a linear pattern with the power rankings going up as the draft picks do. Is this what we get? Of course it isn't!
Much to my surprise, there are picks all over the place all the time. Early in the draft, there are picks that end up being total duds. Later in the draft, there are picks who end up being studly leaders who hoist their teams on their back and make their owners consider homosexuality or, in Justine's case, heterosexuality. I figured that the data is noisy, sure, but perhaps there were trends lurking that I would need the computer to tease out for me. But no! That is not the case! You can see that the linear regression, such as it is, fits the data insanely poorly yielding an R-squared of but 0.13. To the un-stat-savvy, or as my wife likes to call them, "normal people," this means more or less that there is only a 13% chance that there is any trend in this data!
"Well," you say casting a critical eye to my graph, "that is because the late rounds skew the data too much. If you look early, there will be a much stronger regression. True?
No! Untrue! There is even less of a trend in the early rounds than in the late (Again, looking at R-squared shows only a 2% chance that there is any trend in this data! 2% There is more cream in milk than that! Well, only in half and half. It is the exact same amount as is in 2%. But even that is too rich for me!)! I think that the only thing that you can say is that the first 20 guys picked will be pretty good, but really, will sort of be a similar mish-mash of strong players. While there is a good chance that you will get a buy who will carry your team in those first rounds, there is also an equally good chance that you will get a guy who is just OK, or even worse, totally stinks up the joint!
How can this be! How can the draft mean so little in the final reckoning? There are several notable cases that bear looking at:
-The top player at the end of the season has only come from the top 20 picks in the draft twice (Albert Pujols picked number 2 in 2009 and Matt Kemp picked number 15 last year). The other top player was Carlos Gonzalez in 2010 picked all the way in the 11th round at pick 109.
-The 5th highest rated player has never come from a round higher than the 4th, with the highest being Joseph Batthews picked #35 in 2011, Josh Hamilton picked #44 in 2010, and Joe Mauer picked #81 in 2009.
-The average number pick for the top-10 in the final power ranking was #26, as in you would be more likely to find a top-10 guy in the 3rd round or above than in the first round (*nb - I have a more thorough analysis of this type of phenomenon coming up later, but rest assured, this statement is not a wild misinterpretation of the data).
-3 players picked in the top 5 picks have finished ranked #100 or below: Hanley Ramirez picked 2nd in 2011 finished a disastrous #258, Jose Reyes picked 4th in 2009 finished a basically-didn't-matter 456th, and Chase Utley picked #5 in 2010 finished #110. How are those Marlins of Miami's chances looking now, boyee?
-The safest player in the last 3 years: Albert Pujols. He has been picked #2, #2, and #1 and finished #1, #2, and #11 in 2009, 2010, and 2011, respectively. Miguel Cabrera, the first off the board in a lot of the literature I have been reading was picked #6, #8, and #4 and finished #9, #4, and #4. Two new situations, probably no new outcomes. Another new situation: Ryan Braun. He was picked #5, #4, and #5 and finished #3, #13, and #2 in the past. With these 50 games possibly being levied against him for whatevers, where will he go in the draft?
-Consistently overrated: Captain Crunch Sabathia. Picked #16, #19, and #24, he finished only #48, #56, and #61. With wins out of the scoring this year, I can't imagine CC being on any of my teams, which of course means that I will get nervous and take him waaaaay too early. Also overrated: Jimmy Rollins. Picked #9, #18, and #66, he finished #123, #369, and #78.
My heart enters into that elevated and erratic pitter patter that would put less fit people in the hospital. My too-close-together eyes dilate as if thrown into blinding sunlight from a dark lair. My blood boils into my wang like that Typhoon that wiped Japan off the map a year ago.
The Draft.
The hours spent preparing, the petaflops spent calculating, the photons generated deep inside Sol travelling through the vacuum of space to hit printed words in Fantasy Baseball magazines and then be deposited into my rods or cones. All wasted when Lenny Dykstra picks Miguel Cabrera 4th and my entire strategy is thrown into disarray.
The Draft.
120 seconds stretches out to infinity as all sounds die away and my world distills down to myself, my computer screen, and a long list of players. Hunter Pence? Brandon Phillips? I could get a top-line starter here. If I don't take a second baseman now, I will have to get someone at the bottom of the barrel. Ichiro will get hits and steals, but without the Ding-a-lings, how can I make up RBIs and OPS? Bill James predicts a big year from Joseph Bats, but that hack comedy writer Matthew Berry doesn't buy in; who to trust! I love numbers but yet Berry has a podcast! What does that mean! What does any of it mean! The timer begins to beep and what had been an eternity is now but 4 seconds. Ichiro? Phillips? Bats? Rios? Help me Jebus! "Jayson Werth!" I hear a disembodied voice call out. And just like that, my fantasy season is destroyed.
The Draft.
But wait a minute here, what does the draft really mean? The year that my beloved Ackbars strode easily to victory, my first pick was solid, but my next 4 were pretty much garbagio. Other than Woo Woo, we pretty much all make our hay on the free agent wire; the drafted players do yeoman work, but they are rarely the decisive factor. Is the draft pointless? Does draft position have anything to do with how strong a player will be after all accounts have been closed? Unclear. Let's take a look at some hard data and see if we can draw any conclusions.
I looked back at the drafts from the past 3 years and then pulled out the ESPN power rankings of the top 500 players for these years as they stood at the end of the year. If a player finished outside of the top 500 for that year, he got a power ranking of 500. All keepers have been excluded in this analysis. Before you look below, think about what you would expect: The guys at the beginning of the draft would be the highest rated at the end of the year, so you would expect pretty much a linear pattern with the power rankings going up as the draft picks do. Is this what we get? Of course it isn't!
Much to my surprise, there are picks all over the place all the time. Early in the draft, there are picks that end up being total duds. Later in the draft, there are picks who end up being studly leaders who hoist their teams on their back and make their owners consider homosexuality or, in Justine's case, heterosexuality. I figured that the data is noisy, sure, but perhaps there were trends lurking that I would need the computer to tease out for me. But no! That is not the case! You can see that the linear regression, such as it is, fits the data insanely poorly yielding an R-squared of but 0.13. To the un-stat-savvy, or as my wife likes to call them, "normal people," this means more or less that there is only a 13% chance that there is any trend in this data!
"Well," you say casting a critical eye to my graph, "that is because the late rounds skew the data too much. If you look early, there will be a much stronger regression. True?
No! Untrue! There is even less of a trend in the early rounds than in the late (Again, looking at R-squared shows only a 2% chance that there is any trend in this data! 2% There is more cream in milk than that! Well, only in half and half. It is the exact same amount as is in 2%. But even that is too rich for me!)! I think that the only thing that you can say is that the first 20 guys picked will be pretty good, but really, will sort of be a similar mish-mash of strong players. While there is a good chance that you will get a buy who will carry your team in those first rounds, there is also an equally good chance that you will get a guy who is just OK, or even worse, totally stinks up the joint!
How can this be! How can the draft mean so little in the final reckoning? There are several notable cases that bear looking at:
-The top player at the end of the season has only come from the top 20 picks in the draft twice (Albert Pujols picked number 2 in 2009 and Matt Kemp picked number 15 last year). The other top player was Carlos Gonzalez in 2010 picked all the way in the 11th round at pick 109.
-The 5th highest rated player has never come from a round higher than the 4th, with the highest being Joseph Batthews picked #35 in 2011, Josh Hamilton picked #44 in 2010, and Joe Mauer picked #81 in 2009.
-The average number pick for the top-10 in the final power ranking was #26, as in you would be more likely to find a top-10 guy in the 3rd round or above than in the first round (*nb - I have a more thorough analysis of this type of phenomenon coming up later, but rest assured, this statement is not a wild misinterpretation of the data).
-3 players picked in the top 5 picks have finished ranked #100 or below: Hanley Ramirez picked 2nd in 2011 finished a disastrous #258, Jose Reyes picked 4th in 2009 finished a basically-didn't-matter 456th, and Chase Utley picked #5 in 2010 finished #110. How are those Marlins of Miami's chances looking now, boyee?
-The safest player in the last 3 years: Albert Pujols. He has been picked #2, #2, and #1 and finished #1, #2, and #11 in 2009, 2010, and 2011, respectively. Miguel Cabrera, the first off the board in a lot of the literature I have been reading was picked #6, #8, and #4 and finished #9, #4, and #4. Two new situations, probably no new outcomes. Another new situation: Ryan Braun. He was picked #5, #4, and #5 and finished #3, #13, and #2 in the past. With these 50 games possibly being levied against him for whatevers, where will he go in the draft?
-Consistently overrated: Captain Crunch Sabathia. Picked #16, #19, and #24, he finished only #48, #56, and #61. With wins out of the scoring this year, I can't imagine CC being on any of my teams, which of course means that I will get nervous and take him waaaaay too early. Also overrated: Jimmy Rollins. Picked #9, #18, and #66, he finished #123, #369, and #78.
Friday, February 17, 2012
Batting Facts
Looking at the teams' batting statistics is a different beast than the pitching. Whereas a good starter will maybe put in 35 starts, a good hitter will easily clear 500 plate appearances. The sheer weight of the data is enough to change the tilt of the Earth I say! The tilt! To start off, let's just look at a few interesting facts from last year:
-Kemporer Mattpaltene (that is would be Matt Kemp) was not only an integral cog in his fantasy machines last year, but to his real life team as well. Matt Kemp had the greatest part of his total team's offense in the league last year accounting for 18.4% of his team's runs and fully 21% of his team's RBIs last year. To give you an idea of how large a proportion of the team's offense was centered around this one guy, the next largest proportion of runs on a team came from Curtis Granderson who put up only 15.7% of the Yankees many many runs. That means that the Kemporer contributed 20% more runs to his team than the next guy down the line. Alternately, compare it to Prince Fielder, who accounted for the second highest proportion of his team's RBIs with but 17.7% of his team's total RBI. On the low end theory of these metrics are the Giants, whose leading scorer was the Kung Fu Panda who accounted for just under 10% of his team's runs, and to the Metropolitans, whose leading rbi-guy was Carlos Beltran with just under 10% of his team's RBIs.
-The entire premise of Moneyball was that despite normal metrics used to assess baseball, Jonah Hill is better when he is fat. Also, getting on base is the most important thing, regardless of how you do it. With this in mind, I looked at which teams were most effective in converting men on base into men without pants, hubba hubba! The Rangers bring fully 40.5% of the runners they send out to the bases back home, a healthy 854 runs from 2109 men on base (hits+walks+hbp). They were followed by the Yankees, who brought home 40.2% of their runners (867 runs, 2152 men on base). This was surprising as it always seemed like the Yankees couldn't get guys in when they most needed it, but perhaps it was simply that they scored so often that the times when they didn't were glaring or, more as I remember it, heart rending, soul crushing, and making one believe in anything anymore impossible. The team that stranded the most men on the base paths was the sad Giants, who brought in only 31.2% of their runners.
-For pitchers and their fantasy managers, the unearned run is something to be pleased with. For batters and their fantasy managers, the exact opposite is true. These two are diametrically opposed to what their real life teams feel, interestingly. The team who had to earn highest percentage of the runs that they scored was the Brewers who had to earn 97.3% of their runs. They were followed by the Orioles, who had to earn 96.9% of their runs. The Twinkies had to earn only 92.2% of their runs, the lowest in the league. It is interesting that these numbers did not at all mesh with the number of stolen bases that a team has. I had always thought that one of the best things about the speedsters is that they distract the pitcher and cause confusion among the infielders leading to errors on the basepaths and more unearned runs. This is not the case however, as the teams with the greatest number of stolen bases, the Rays and the 'Dres (155 and 162, respectively), had middling percentages of unearned runs (both 95.2%).
Friday, February 3, 2012
Stats Dependent on Teams: Saves vs. Wins
One of the reasons that has been cited for the recent and somewhat common move from wins to quality starts is that pitchers should be rewarded for pitching well rather than being at the whim of their offense or bullpen (Actually, no reasons have even been given for this authoritarian directive that was handed down without notice or discussion. Historically, people have liked having rules imposed on them by an tyrannical regime.). However, saves remain a vital category in this league as in many others. Do saves rely on the strength of a team in the same was as wins do? How do quality starts fit into the mix? Let us examine these questions in absurd detail.
The first question is whether wins do, in fact, rely on the strength of a team. I looked at the amount of wins from a team's starting staff versus the amount of wins that a team put up in total.
Not surprisingly, these two numbers were pretty well associated. From the last 5 years of pitching, each team win would mean an 84% chance of an individual win (the slope of the line, the number before the "x" in the equation). Moreover, this association was quite strong as the R-square was up at 0.65. No one would be surprised that when teams win, their starters win, but for fantasy purposes, this statistic becomes somewhat troubling; independently of the other pitching categories, if you pick a pitcher on a team that wins a lot, he will quite likely put up some wins. The true value of the pitcher will be watered down by the strength of the team. This would add value to pitchers like Phil Hughes in 2010 (18 wins, 4.18 ERA) and AJ Burnett in 2008 (18 wins, 4.06 ERA) who each benefitted from the dominance personified Yankees offense. The Red Sox of 2007 were able to support Tim Wakefield to an insane degree (17 wins, 4.76 ERA), as did the 2007 Rockies for Jeff Francis (17 wins, 4.22 ERA) and more recently the 2011 Tigers for Ackbar-killing Max Scherzer (15 wins, 4.43 ERA). Conversely, stat-outlier Matt Cain has seen his value diminished by his team's lack of accumen at the game upon which we are currently elocuting as in 2011, he posted a 2.96 ERA while accruing only 12 wins in 26 outings. Similarly, Jake Peavey (10 wins, 2.85 ERA in 2008, 27 games), Ryan Vogelsong (13 wins, 2.70 ERA in 2011, 30 games), and famously Felix Hernandez (13 wins, 2.27 ERA in 2010, 34 games) all were hurt by their team's lack of wins.
However, the question remains: Do quality starts have a similar association with team wins? Will we be able to pick up 4th starters on the Yankees and count on them to have quality starts? Survey says....
...not nearly as much. Each additional team win was associated with only 0.44 of a quality start, and that association was quite weak, yielding an R-square of only 0.20. While one interpretation of this data would be that when a pitchers puts up quality, his team will most likely win, this is not the case: for each quality start, a team will only have 0.45 extra wins, an association which is similarly weak at 0.20 R-square (data not shown). Indeed, by and large, it would seem that scoring quality starts rather than wins would take the team out of the equation. This brings up the interesting question, though: Are saves not similarly dependent on the team? I mean, surely, the Yankees with 100+ wins will have more saves than the Buccos. Should we drop saves as a category? Data, do you have something to say on this topic?
Strangely enough, each team win yielded only 0.44 of a save, a similar yield to quality starts. The strength of association was also right in the middle of the previous two with an R-square of 0.43. Despite this weak association, it was much stronger than the association of team wins with save opportunities (the yellow guys):
Each additional team win was associated with only 0.26 of an extra save opportunity, and that association was the weakest of the bunch with an R-square of 0.14. Indeed, it appears that teams will stumble into save opportunities and only teams that are able to convert those into wins will be able to have any association at all. In other words, save opportunities will come to every team, but the closer will have to be good in order to convert them.
The bottom line of all of this appears to be that the scoring changes are somewhat valid if the aim is to shift the focus from the team to the individual player. I guess that the armed revolt will wait another day. Perhaps that day will when FAAB is brought into the equation.....
The first question is whether wins do, in fact, rely on the strength of a team. I looked at the amount of wins from a team's starting staff versus the amount of wins that a team put up in total.
Not surprisingly, these two numbers were pretty well associated. From the last 5 years of pitching, each team win would mean an 84% chance of an individual win (the slope of the line, the number before the "x" in the equation). Moreover, this association was quite strong as the R-square was up at 0.65. No one would be surprised that when teams win, their starters win, but for fantasy purposes, this statistic becomes somewhat troubling; independently of the other pitching categories, if you pick a pitcher on a team that wins a lot, he will quite likely put up some wins. The true value of the pitcher will be watered down by the strength of the team. This would add value to pitchers like Phil Hughes in 2010 (18 wins, 4.18 ERA) and AJ Burnett in 2008 (18 wins, 4.06 ERA) who each benefitted from the dominance personified Yankees offense. The Red Sox of 2007 were able to support Tim Wakefield to an insane degree (17 wins, 4.76 ERA), as did the 2007 Rockies for Jeff Francis (17 wins, 4.22 ERA) and more recently the 2011 Tigers for Ackbar-killing Max Scherzer (15 wins, 4.43 ERA). Conversely, stat-outlier Matt Cain has seen his value diminished by his team's lack of accumen at the game upon which we are currently elocuting as in 2011, he posted a 2.96 ERA while accruing only 12 wins in 26 outings. Similarly, Jake Peavey (10 wins, 2.85 ERA in 2008, 27 games), Ryan Vogelsong (13 wins, 2.70 ERA in 2011, 30 games), and famously Felix Hernandez (13 wins, 2.27 ERA in 2010, 34 games) all were hurt by their team's lack of wins.
However, the question remains: Do quality starts have a similar association with team wins? Will we be able to pick up 4th starters on the Yankees and count on them to have quality starts? Survey says....
...not nearly as much. Each additional team win was associated with only 0.44 of a quality start, and that association was quite weak, yielding an R-square of only 0.20. While one interpretation of this data would be that when a pitchers puts up quality, his team will most likely win, this is not the case: for each quality start, a team will only have 0.45 extra wins, an association which is similarly weak at 0.20 R-square (data not shown). Indeed, by and large, it would seem that scoring quality starts rather than wins would take the team out of the equation. This brings up the interesting question, though: Are saves not similarly dependent on the team? I mean, surely, the Yankees with 100+ wins will have more saves than the Buccos. Should we drop saves as a category? Data, do you have something to say on this topic?
Strangely enough, each team win yielded only 0.44 of a save, a similar yield to quality starts. The strength of association was also right in the middle of the previous two with an R-square of 0.43. Despite this weak association, it was much stronger than the association of team wins with save opportunities (the yellow guys):
Each additional team win was associated with only 0.26 of an extra save opportunity, and that association was the weakest of the bunch with an R-square of 0.14. Indeed, it appears that teams will stumble into save opportunities and only teams that are able to convert those into wins will be able to have any association at all. In other words, save opportunities will come to every team, but the closer will have to be good in order to convert them.
The bottom line of all of this appears to be that the scoring changes are somewhat valid if the aim is to shift the focus from the team to the individual player. I guess that the armed revolt will wait another day. Perhaps that day will when FAAB is brought into the equation.....
Monday, January 16, 2012
Interlude - Saves
Some thoughts as I am getting more concrete data on relievers. Prepare to have your mind blown!
-Do you know how many blown saves there were last year? That number would be 575. That is a staggering number. There are fewer stars in the galaxy than that! That is untrue, of course. Still staggering.
-Do you know that there are 8 teams that have 10 or more blown saves from pitchers who never even recorded a single save (Colt 45s, Klue Klays, Bravos, Brewers, Marlins, Natinals, Padres, and Rockies)! 3 guys blew 7 saves each without converting a single one. One of them was Aaron Crow! That guy was on my team for a short period last year! Why do they keep getting the ball in the 9th! 7 saves blown! Not a single one converted! What is this, the '06 Yankees season and we are talking about Kyle Farnsworth? Managers: these guys stink. Don't give them the ball. What are we talking about here!
-In the entire league last season, there were 1818 save opportunities. 31.6% of them were blown. Have I truly been so spoiled by a decade of Mariano Rivera and his delicious steaks outside of New Rock City that this number is almost certainly incorrect (of course it is correct)?
-How do you think the Colt 45's numbers of saves matches up with their number of blown saves. Those two numbers are approximately equivalent, or more precisely, exactly the same. They saved 25 and they blew 25. While Mark Melancon didn't exactly light the world on fire with 20 whole saves, without him, they would have blown 4 times the number of saves that they accrued (20 blown, 5 saved). Wilton Lopez blew 6 saves himself without ever successfully converting a chance. Brandon Lyon, a legit fantasy option the season before last, blew 3 himself. I drafted him in the 20th round. Do you know who else I could have gotten in that round? Albert Pujols, that's who. Well, actually, that's not who. I could have gotten some other trash like Jason Kubel, but the fact remains!
Pitchers: A New Look - HR Rate
So I have this big spreadsheet with all sorts of data from the 2011 campaign for pitchers that I was using for my previous post on the quality starts rule change, and I sit here looking at it and saying to myself, "Is 1 post all that I can really derive from such a wealth of data? So many columns were unused! So many metrics undiscovered and unreported on! There must be something more." Well, it turns out that there is more (yes, I know it is hard to believe that a huge spreadsheet could yield more than a pithy analysis of quality starts). Behold: Your More!
You know what is the worst? When you place a big take out order and you get home and, of the 10 people who are getting food, you are the only one whose order was forgotten. Or perhaps when you are going to sleep and you reach over to turn of the light, and you knock over your glass of water necessitating a lengthy clean up process. For the porpoises of this post, though, lets consider the case of when your pitcher is throwing a decent game, the bases get loaded up, and rather than hitting a sac fly or striking out, he gives up a ding-a-ling thus destroying his outing in one swing of the bat. Indeed, the dong is a complete force-multiplier for the both offense and the defense; one swing can boost up 5 hitting categories and very realistically destroy 3 defensive categories (even more now that quality starts are included in the scoring).
I looked at which pitchers had the highest ratio of HRs per Earned Runs thinking that the pitchers who had the highest HR/ER ratio would be the guys who would have most been hurt by the long ball. In essence, if these guys had the wind blowing in a little bit more or played with outfielders who timed their jumps a little better, their ERs would go down. The pitcher with the highest HR/ER ratio was the Reds' Bronson Arroyo (Bernie) who had a staggering 46 HRs to a still-pretty-high 112 earned runs. More interesting is the next guy on the list, the Tigers' Justin Verlander (Peachz) who gave up 24 HRs to only 67 earned runs. His last season was Ghengis Khan-ian in its murderous ferocity, and there was room for improvement. Oh, and he is a keeper. Thanks Justine! Another notable name at the top of the range are the Yankees newest acquisition, Hiroki Kuroda (Fooey) with 24 HRs to only 69 earned runs. Last week, you would have thought that his under-spoken-of 3.07 ERA could get even lower, but in the bandbox that A-Rod built, this number may go up. Others who got stung by the long ball are Josh Beckett (Dykstra), Jeremy Helleckson (Dykstra), Wandy (WooWoo), YoGa (WooWoo), and Theodore Roosevelt Lilly (Ackbar).
On the flip side, the Buccaneer Charlie Morton gave up a paltry 6 HR to 73 earned runs. The extreme ground-ballers will always limit their damage from loaded bases, but they will balance out this benefit with a lack of Ks. As our league favors power pitchers, guys like Morton or Wang will never find permanent homes on any teams. Matt Cain (Ackbar) only gave up 9 HR to 71 earned, followed by Derek Lowe (Bernie) with 14 HR to 105 earned, and Buzzsaw Billingsley (Allah) with 14 HR to 88 earned. These guys could see their ERAs rise this coming season, though they also could not. Who the hell knows.
Pitchers: A New Look - uERA
So I have this big spreadsheet with all sorts of data from the 2011 campaign for pitchers that I was using for my previous post on the quality starts rule change, and I sit here looking at it and saying to myself, "Is 1 post all that I can really derive from such a wealth of data? So many columns were unused! So many metrics undiscovered and unreported on! There must be something more." Well, it turns out that there is more (yes, I know it is hard to believe that a huge spreadsheet could yield more than a pithy analysis of quality starts). Behold: Your More!
There were a number of times last year when I would be playing one of you punks and I would check out the MLB score before bed and see that a team facing an opposing fantasy team's pitcher put up a monster number of runs. Cheered, I would drift off to a troubled sleep with dreams filled with zombies and awkward moments. It would only be in the morning that I checked the box scores and noticed that, despite giving up 7 runs, the offending pitcher was only charged with 1 as his defense failed him. I understand the rules of earned versus unearned runs (actually, I sort of don't, they seem to shift like the desert's sands), but really, when a pitcher loads them up and then gives an error clears the bases, how can he get so few earned! I feel like those pitchers had their ERAs artificially lowered and are, in fact, worse pitchers than their ERAs say. The pitcher (who played on a team in our league) who gave up the highest percentage of unearned runs was Jaime Garcia (Dykstra), who gave up 100 runs but was only charged with only 77 of them, hanging fully 23% on the defense. Had those runs been earned, he would have been saddled with with a 4.63 uERA (Unearned Run Average) rather than the 3.55 ERA that he posted. The Cardinals, in fact, were the worst defensive team in terms of supporting their starting pitchers with only 87.3% of the total runs given up by their starters being charged to them. Next was Johnny Cueto (Peachz), with 21% of runs on the defense (51 given up versus 40 charged) bringing his uERA to a still-pretty-good 2.94 rather than 2.30. Third was Matt Garza (Bernie) who had 18% of his runs caused by the defense (90 given up versus 73 charged) having a Mendoza-Linian 4.09 uERA versus his serviceable 3.31 ERA. On the flip side, the pitchers who were big earners were Esmil Rodgers (Bernie), Phil Hughes (Ackbar), and Travis Wood (Ackbar) who earned every single one of their runs. In the "actual decent pitchers" category, Cole Hamels' (Ackbar) defense only fudged 1 run for him and Ian Kennedy's (Peachz) only 2. Think about that for a second: those two guys were aces in every sense of the word except for the actual definition, but if 8% of their runs been charged to the defense (the league average), their ERAs would be 2.60 for Hamels (versus 2.79) and 2.71 for Kennedy (versus 2.87). For Hamels, this is to be expected as the Phillies defense was the most supportive of their starters with fully 95.1% of the runs that the starters gave up being earned. Kennedy was another story with the DBack pitchers having a middle-of-the-pack 92.1% of runs charged to their starters. Do you remember when Ian Kennedy came up from the minors? What a mess he was in New York. WTF Ian Kennedy?
Sunday, January 15, 2012
Quality Starts, Schmality Schwartz!
Good ol' Schmality. He was my lab partner in Orgo sophomore year. That guy could rotovap like nothing I have ever seen previously or since.
These new changes to the league are horrible! I mean, adding Chandler? Who is this guy? A decorative hanging light with branches for several light bulbs or candles? A female comedianne who has a new NBC sitcom whose title replaced the word "Vodka" with her first name? A town in Upper Hominy, NC? What's that off-screen voice? Oh, you said Chandler. I misheard you. That I am cool with. Welcome Chandler! You literally only need have a pulse to be a more active participant in the league than Andrew. Will you ever read these words? I doubt it. Why would you be any different than the rest of the human population.
Of course, the above few lines are in jest, I have no life threatening problems with the rules changes. I mean, I am not a fan, but I have a feeling that is more because of Newtonian physics (inertia and whatnot) than any real problem with them. Switching from wins to quality starts will make some pitchers get better, some get worse, the very notion of fantasy sports will be further cemented as having nothing to do with real life baseball and will be more based on individual performances than actual baseball outcomes. I am less interested in how the changes will affect the league than which players will see their values modified.
I looked at last year's pitching statistics for the real life MLB league and was able to extrapolate a few key findings that may change how you perceive the very reality in which you have grown comfortable.
Not surprisingly, this rule change will most benefit starters and disfavour relievers. The pitchers who would have most profited from this rule change are Matt Cain (an Ackbar) and R.A. Dickey (Never pitched an inning for our league). Both of these "pitchers" "pitched" 14 more quality starts "than" they turned in wins. Think about that in this coming draft: Matt Cain had a 2.88 ERA and should have had a lot more wins than he did while striking out a respectable 7.26 guys per 9. Next, Brett Myers was next with 12 fewer wins than quality starts next, followed by 5 guys with 11 (notably Tim Stauffer who I picked up for 3 spot starts, all of which went horribly, and Anibal Sanchez, who still was quite the waver wire pick up for the Omars. Imagine him with an extra 11 wins and all those K's. Indeed.).
Conversely, the reliever who will most suffer from this rule change is something called a "Matt Belisle" that somehow managed to acrue 10 wins without a single quality start. After that thing, Eddie "The Mooch" Mujica had 9 wins in relief, followed by a bunch of guys with 8 wins, most notably Mark Melancon who was also able to put up 20 saves for the Dykstras. Interestingly, John Lackey and Esmil Rodgers both has 3 more wins than quality starts meaning that they got quite lackey, er, lucky. Both spent some time on teams in the league (The Peachz and the Bernies, respectively). They were both horrible, and just when you thought it couldn't get any worse, they were actually worse than their stats indicated.
Beyond individual pitchers, one of the real consequences of this rule change is that we can no longer say, "pick up all Yankees pitchers, with their offense, they will win games if their pitcher puts in a quality start." Looked at more statistically, the teams who could most be counted on for producing wins from quality starts were the Red Sox and the Yankees, producing 88.4% and 84.5% of the wins that they had quality starts. In other words, Yankee and Red Sox pitchers will be less valuable this coming season than they were last. Conversely, the Colt 45s and Marlins formerly of Florida, presently of Miami only produced 44.3% and 48.8% of the wins as they did of quality starts. Not surprisingly, these two had two of the worst bullpens in the majors producing 55 and 50 decisions (wins or losses) last season. Along with the Cardinals, Bravos, and Reds all had 50 or more decisions coming from the pen. Without all those bullpen disasters, the pitchers on these teams should see their stocks rise marginally. The Dbacks and the Dodgers had the fewest decisions coming from the pen, though the meaning of this is obscured from my too-close-together-eyes. Did you know that I can only use 2 of the 7 microscopes in my lab because these are the only two whose eye pieces come close enough together to accommodate my cyclopean mug? God, I am a hideous goblin.
These new changes to the league are horrible! I mean, adding Chandler? Who is this guy? A decorative hanging light with branches for several light bulbs or candles? A female comedianne who has a new NBC sitcom whose title replaced the word "Vodka" with her first name? A town in Upper Hominy, NC? What's that off-screen voice? Oh, you said Chandler. I misheard you. That I am cool with. Welcome Chandler! You literally only need have a pulse to be a more active participant in the league than Andrew. Will you ever read these words? I doubt it. Why would you be any different than the rest of the human population.
Of course, the above few lines are in jest, I have no life threatening problems with the rules changes. I mean, I am not a fan, but I have a feeling that is more because of Newtonian physics (inertia and whatnot) than any real problem with them. Switching from wins to quality starts will make some pitchers get better, some get worse, the very notion of fantasy sports will be further cemented as having nothing to do with real life baseball and will be more based on individual performances than actual baseball outcomes. I am less interested in how the changes will affect the league than which players will see their values modified.
I looked at last year's pitching statistics for the real life MLB league and was able to extrapolate a few key findings that may change how you perceive the very reality in which you have grown comfortable.
Not surprisingly, this rule change will most benefit starters and disfavour relievers. The pitchers who would have most profited from this rule change are Matt Cain (an Ackbar) and R.A. Dickey (Never pitched an inning for our league). Both of these "pitchers" "pitched" 14 more quality starts "than" they turned in wins. Think about that in this coming draft: Matt Cain had a 2.88 ERA and should have had a lot more wins than he did while striking out a respectable 7.26 guys per 9. Next, Brett Myers was next with 12 fewer wins than quality starts next, followed by 5 guys with 11 (notably Tim Stauffer who I picked up for 3 spot starts, all of which went horribly, and Anibal Sanchez, who still was quite the waver wire pick up for the Omars. Imagine him with an extra 11 wins and all those K's. Indeed.).
Conversely, the reliever who will most suffer from this rule change is something called a "Matt Belisle" that somehow managed to acrue 10 wins without a single quality start. After that thing, Eddie "The Mooch" Mujica had 9 wins in relief, followed by a bunch of guys with 8 wins, most notably Mark Melancon who was also able to put up 20 saves for the Dykstras. Interestingly, John Lackey and Esmil Rodgers both has 3 more wins than quality starts meaning that they got quite lackey, er, lucky. Both spent some time on teams in the league (The Peachz and the Bernies, respectively). They were both horrible, and just when you thought it couldn't get any worse, they were actually worse than their stats indicated.
Beyond individual pitchers, one of the real consequences of this rule change is that we can no longer say, "pick up all Yankees pitchers, with their offense, they will win games if their pitcher puts in a quality start." Looked at more statistically, the teams who could most be counted on for producing wins from quality starts were the Red Sox and the Yankees, producing 88.4% and 84.5% of the wins that they had quality starts. In other words, Yankee and Red Sox pitchers will be less valuable this coming season than they were last. Conversely, the Colt 45s and Marlins formerly of Florida, presently of Miami only produced 44.3% and 48.8% of the wins as they did of quality starts. Not surprisingly, these two had two of the worst bullpens in the majors producing 55 and 50 decisions (wins or losses) last season. Along with the Cardinals, Bravos, and Reds all had 50 or more decisions coming from the pen. Without all those bullpen disasters, the pitchers on these teams should see their stocks rise marginally. The Dbacks and the Dodgers had the fewest decisions coming from the pen, though the meaning of this is obscured from my too-close-together-eyes. Did you know that I can only use 2 of the 7 microscopes in my lab because these are the only two whose eye pieces come close enough together to accommodate my cyclopean mug? God, I am a hideous goblin.
Wednesday, April 6, 2011
Draft Recap Part 3, the final part - By $alary!
In our draft for D&D Baseball: The Gathering, we picked any players regardless of how much their contracts would drive up ticket prices for our elven fans. I looked at the 2011 cost of each of the players picked in the draft to see if there was any correlation between where a player was picked and how much he made. This beautiful tricolore graph that you see below this text that you are currently reading shows how much the average, maximum, and minimum salary of a given round measures against the average, maximum, and minimum spent in the average round. In round 20, for example, the total salary was the exact same as the average salary per round of the total draft as shown by the fact that it measures a 1.0, or 100% on the graph. Below the 1.0 line means that that round had a lower average than the average round, above means a higher average than the average round. Confused yet? Too bad! That is all the explanation that will be given.
By and large, it seems like each round of the draft was fairly, well, average. In the early rounds, there was a lot of money spent (round 1 had a total of $118 million, round 2 had a total of $138 million, the average per round was $63 million), but the most expensive player in those rounds wasn't significantly more expensive than the average most expensive player per round. This becomes clear when you look at the most expensive players in each round:
Each one of these is a high priced player, some who have lived up to the contract, others who have not. Only in round 2, where ARod, the highest payed player in the history of the game, the man whose salary could have bought Bear Sterns and had money left over, was significantly over the average maximum salary per round ($31 million as opposed to the average maximum of $15.8739 million). Where the biggest difference lies is in the minimum salary per round. Only in the second round, where Nelson Cruz was the lowest paid player taken, was the lowest paid player significantly above the average lowest salary for all the rounds. Cruz's'z contract, which pays him $3.6 million this year, is quite a bit more than many of the other minimum salaries of the lowest paid players in the rounds who made the league minimum of around $450k, and more than the average minimum salary of $811,976.9833. Players who made the league minimum were taken in an overwhelming majority of the rounds, starting as early as round 3, where the Dread Pirate was taken by Omar at a full 50 times lower salary than the highest paid player in that round, CC Sabathia ($450k vs $23 million). Even in the first round, there were 5 players whose salary was $5.5 million or below (Braun, Tulo, AGon, and Votto). Conversely, even in the 23rd round, there were players who signed large contract years ago and failed to deliver (AJ Burnett at $16.5 million and Lance Berzerkman at $8 million). Indeed, there was talent to be found in all rounds of the draft no matter what the price tag.
I next wanted to look at the total payrolls of each of the teams. Tabulating the team that hit the field opening day, I found that Andrew's team was by far the most expensive team, but the rest of the teams were all pretty clustered together.
Looking at the makeup of Andrew's team reveals the reason for his free spending: the glut of Yankees on his Roster. Between ARod, Jeter, Mariano, and AJ Burnett, Andrew spent $77,5000,000, alomst 75% of Omar's complete roster and about half of the average team payroll. It was also interesting to note that, despite going quite young on his team, Lenny Dykstra didn't save much on his payroll having the 7th highest payroll in the league. Omar, coming in with the lowest payroll of $91 million, saved a lot of money by having his high round draft picks be cheap players who will soon be free of the sheckels of thier minor league long term deals. Joey Votto, David Wright, Andrew Mccutchen, and Hunter Pence were his first 4 draft picks and had a total salary of $26 million, less than twice the average salary for the 6 highest paid first rounders alone (Pujols, Hanley, Miguel Cabrera, Halladay, Holliday, and Crawford. Average salary: $16 million). Indeed, Omar sniffed out that value quite nicely.
Finally, I wanted to look at the spending habits of each team individually. I found who was the highest and lowest paid player for each round, as you saw above, and correlated that with who picked them. In other words, which teams were the most swayed by the high price of admission and which were the biggest bargain seekers.
As predicted, Andrew broke the piggy bank 7 times (ARod, Mauer, Jeter, Ethier, El Caballo, Derek Lee, and AJ Burnett) the most of any of the teams. As some may have predicted perhaps maybe, Ackbar sought value 5 times (Young, Scherzer, Daniel Hudson, Jose Tabata, and Jesus Montero) ,but was not the most value conscious drafter in the league. That honor went to Omar, who only spent the most in a round once all the way in round 21 with Big Z, but spent the least 5 times (McCutchten, Pedro Alvarez, Kershaw, Travis Snider (?) and Matt Wieters). Fooey and Bernie were the most boring spenders only going for the most expensive and least expensive players in a round once (Roy Oswalt and Travis Wood, and Carlos Beltran and Brett Anderson, respectively).
So that's it, that is how we drafted. I highly doubt that anyone made it all the way to the bottom of this post without skipping over some portions of what I have written. That's ok! I don't mind! If you read any of it, though, put a thought in the comments section! Or Email me if you want to write a post! That will be the last plea, but the offer will remain for the season. Also remember, while I wrap these numbers around myself like a warm blanket at night, you can write about individual players, as Tim previously had with Ben Zobrist, or weird lists about most upsetting injury or most soul crushing home run of the week or something! I know from seeing you (YOU!) during the season that you have a lot to say about the fantasy season and the league in general, so why not put that digital pen to paper and those grubby fingeys to keyboard and share it with the league, nay the world in total! You will feel better about yourself! And then much much worse after you hear a room full of silence.
I next wanted to look at the total payrolls of each of the teams. Tabulating the team that hit the field opening day, I found that Andrew's team was by far the most expensive team, but the rest of the teams were all pretty clustered together.
Looking at the makeup of Andrew's team reveals the reason for his free spending: the glut of Yankees on his Roster. Between ARod, Jeter, Mariano, and AJ Burnett, Andrew spent $77,5000,000, alomst 75% of Omar's complete roster and about half of the average team payroll. It was also interesting to note that, despite going quite young on his team, Lenny Dykstra didn't save much on his payroll having the 7th highest payroll in the league. Omar, coming in with the lowest payroll of $91 million, saved a lot of money by having his high round draft picks be cheap players who will soon be free of the sheckels of thier minor league long term deals. Joey Votto, David Wright, Andrew Mccutchen, and Hunter Pence were his first 4 draft picks and had a total salary of $26 million, less than twice the average salary for the 6 highest paid first rounders alone (Pujols, Hanley, Miguel Cabrera, Halladay, Holliday, and Crawford. Average salary: $16 million). Indeed, Omar sniffed out that value quite nicely.
Finally, I wanted to look at the spending habits of each team individually. I found who was the highest and lowest paid player for each round, as you saw above, and correlated that with who picked them. In other words, which teams were the most swayed by the high price of admission and which were the biggest bargain seekers.
As predicted, Andrew broke the piggy bank 7 times (ARod, Mauer, Jeter, Ethier, El Caballo, Derek Lee, and AJ Burnett) the most of any of the teams. As some may have predicted perhaps maybe, Ackbar sought value 5 times (Young, Scherzer, Daniel Hudson, Jose Tabata, and Jesus Montero) ,but was not the most value conscious drafter in the league. That honor went to Omar, who only spent the most in a round once all the way in round 21 with Big Z, but spent the least 5 times (McCutchten, Pedro Alvarez, Kershaw, Travis Snider (?) and Matt Wieters). Fooey and Bernie were the most boring spenders only going for the most expensive and least expensive players in a round once (Roy Oswalt and Travis Wood, and Carlos Beltran and Brett Anderson, respectively).
So that's it, that is how we drafted. I highly doubt that anyone made it all the way to the bottom of this post without skipping over some portions of what I have written. That's ok! I don't mind! If you read any of it, though, put a thought in the comments section! Or Email me if you want to write a post! That will be the last plea, but the offer will remain for the season. Also remember, while I wrap these numbers around myself like a warm blanket at night, you can write about individual players, as Tim previously had with Ben Zobrist, or weird lists about most upsetting injury or most soul crushing home run of the week or something! I know from seeing you (YOU!) during the season that you have a lot to say about the fantasy season and the league in general, so why not put that digital pen to paper and those grubby fingeys to keyboard and share it with the league, nay the world in total! You will feel better about yourself! And then much much worse after you hear a room full of silence.
Tuesday, April 5, 2011
Draft Recap Part 2 - By Age!
Drafting by position or via computerized spreadsheet is well and good, but sometimes, the sight of a young rookie with high upside and the potential to be kept for the next 3 season is good enough to make you throw out all plans, rankings, and vestiges of heterosexuality and take the gambol. Conversely, no matter how good an aged player performs in the previous year, there is always the thought that his broken typewriter body will eventually hit one last pot hole and the screws will come off like in Cool Runnings. To get a sense of how realistic either one of these two hypothetical situations are, I looked at the draft according to age.
The first thing that I noticed looking at this young fellow in the mirror is the even distribution of body hair throughout the torso. Then, when shifting my gaze to this young graph, I saw that the overall distribution of ages in our league seems to peak around 29 years old [a little younger than most people in this league. We are never going to play professional baseball! I cry!] with more older players being picked than younger players, as shown by the more gentle slope on the right of the peak than the left. Moreover, I saw that in the early rounds, there is a very large cluster of ~30 year olds being picked up with very few fogies or youngsters. As we went through the second and third set of set of rounds, this distribution because a bit more heavy on old fellows, but it wasnt until the 13th round where youngsters started to find their way off the board. As things wound down, a new peak at around 24 years old began to rise with people looking for their young keepers. It is interesting that there was so much more faith in the old guys (taken much earlier in the draft) than in the young guns (taken much later in the draft) when it is often the youngsters who end up being the break out stars. At least I found that interesting, and I hope that you did too, though by "you," I mean me, the only one who actually reads this idiotic blog, and I don't even read it that closely after I write it in the first place!
I next wanted to see if there were any teams that were particularly filled with old fellows or youngsters. Looking at the distribution of ages on each particular team, I was surprised to find that the teams were quite different, as you can clearly see below. See it I command!
A few things stood out about these distributions. First is the relative age of Judd and Jeter's teams. Both seemed to load up on older types at the expense of young talent. Perhaps they think they can pick it up on the wire? Who knows what thoughts run through the minds of men! Regardless, look for these teams to have a rash of injuries and resemble the beloved Ackbars, who are currently dealing with, count 'em, 6 players who are not getting into games these days. I was also mesmerized by the youth of Lenny Dykstra's and Texas the Foo's teams, whose players seem to peak at about 26 with only a few wily veterans to show the youngsters the way. Dykstra projects to do well this year, but who knows if those optomistic projections based sometimes on talent alone will translate to major league stats. Beyond that, everyone else seemed to have a bunch of 29 year olds with a few yongsters and a few more old types hanging around, with Woo Woo and Peachz (here in fashionable hot pink!) having the most clustered distributions.
How will the age of these players affect each team? Will the old guys have one more year in their arms or will they crumble like a delicious Drake's Coffee Cake? Will the young fellows be able to withstand the hot glare of the media and perform in the show or will they be more like Steve Nebraska (who actually did both, the breaking down and the performing. Remember the climax of that ludcrous movie when Brendan Frasier pitched in game 7 of the world series after never pitching before in the majors and throwing just 81 pitches, all strikes, in a complete game perfect game 27K performance.) Will these teams have the same age distributions at the end of the season? How will the free agent pickups look in terms of age? I look forward to watching it all unfold.
In other news, my inbox was flooded with people wanting to write on the blog! Hyyyche that and reverse it, no one said "boo." Seriously, if you want to write something, anything, about the league and it wont fit in the message board or you want to attach something or whatnot, shoot me an email! Or a trade offer! I guarantee to always give a counter proposal. Here is a sample topic that you could write about that builds on what you have just read: "The best picks among players over 35" or "The 5 over-35 years olds who will be better than the under-25 year olds drafted in the same round" or something like that. I can furnish you with all the data you could ever need or want, though only about fantasy baseball, sorry Justine, you need to gather that thesis data yourself.
The first thing that I noticed looking at this young fellow in the mirror is the even distribution of body hair throughout the torso. Then, when shifting my gaze to this young graph, I saw that the overall distribution of ages in our league seems to peak around 29 years old [a little younger than most people in this league. We are never going to play professional baseball! I cry!] with more older players being picked than younger players, as shown by the more gentle slope on the right of the peak than the left. Moreover, I saw that in the early rounds, there is a very large cluster of ~30 year olds being picked up with very few fogies or youngsters. As we went through the second and third set of set of rounds, this distribution because a bit more heavy on old fellows, but it wasnt until the 13th round where youngsters started to find their way off the board. As things wound down, a new peak at around 24 years old began to rise with people looking for their young keepers. It is interesting that there was so much more faith in the old guys (taken much earlier in the draft) than in the young guns (taken much later in the draft) when it is often the youngsters who end up being the break out stars. At least I found that interesting, and I hope that you did too, though by "you," I mean me, the only one who actually reads this idiotic blog, and I don't even read it that closely after I write it in the first place!
I next wanted to see if there were any teams that were particularly filled with old fellows or youngsters. Looking at the distribution of ages on each particular team, I was surprised to find that the teams were quite different, as you can clearly see below. See it I command!
A few things stood out about these distributions. First is the relative age of Judd and Jeter's teams. Both seemed to load up on older types at the expense of young talent. Perhaps they think they can pick it up on the wire? Who knows what thoughts run through the minds of men! Regardless, look for these teams to have a rash of injuries and resemble the beloved Ackbars, who are currently dealing with, count 'em, 6 players who are not getting into games these days. I was also mesmerized by the youth of Lenny Dykstra's and Texas the Foo's teams, whose players seem to peak at about 26 with only a few wily veterans to show the youngsters the way. Dykstra projects to do well this year, but who knows if those optomistic projections based sometimes on talent alone will translate to major league stats. Beyond that, everyone else seemed to have a bunch of 29 year olds with a few yongsters and a few more old types hanging around, with Woo Woo and Peachz (here in fashionable hot pink!) having the most clustered distributions.
How will the age of these players affect each team? Will the old guys have one more year in their arms or will they crumble like a delicious Drake's Coffee Cake? Will the young fellows be able to withstand the hot glare of the media and perform in the show or will they be more like Steve Nebraska (who actually did both, the breaking down and the performing. Remember the climax of that ludcrous movie when Brendan Frasier pitched in game 7 of the world series after never pitching before in the majors and throwing just 81 pitches, all strikes, in a complete game perfect game 27K performance.) Will these teams have the same age distributions at the end of the season? How will the free agent pickups look in terms of age? I look forward to watching it all unfold.
In other news, my inbox was flooded with people wanting to write on the blog! Hyyyche that and reverse it, no one said "boo." Seriously, if you want to write something, anything, about the league and it wont fit in the message board or you want to attach something or whatnot, shoot me an email! Or a trade offer! I guarantee to always give a counter proposal. Here is a sample topic that you could write about that builds on what you have just read: "The best picks among players over 35" or "The 5 over-35 years olds who will be better than the under-25 year olds drafted in the same round" or something like that. I can furnish you with all the data you could ever need or want, though only about fantasy baseball, sorry Justine, you need to gather that thesis data yourself.
Monday, April 4, 2011
Draft Recap Part 1 - By Position
To more closely examine the fallout from the draft, I decided to first look at how each position was drafted. I began by looking at the percentage of total draft picks for each bundle of rounds that went to each position.
Conclusions: The first 4 rounds were dominated by corner infielders and outfielders, positions where there is pop to be had and high averages abound. The 5th-8th rounds were dominated by starters with people loading up on their aces and number 2 arms. By the 13th round, relievers were finally going off the board in significant number, and at the end of the draft, people were taking fliers on starters and outfielders.
I also looked at what percentage of each position when in each round, a similar stat to that graph you see up there above.
Conclusions: The first 4 rounds were dominated by corner infielders and outfielders, positions where there is pop to be had and high averages abound. The 5th-8th rounds were dominated by starters with people loading up on their aces and number 2 arms. By the 13th round, relievers were finally going off the board in significant number, and at the end of the draft, people were taking fliers on starters and outfielders.
I also looked at what percentage of each position when in each round, a similar stat to that graph you see up there above.
Three things stand out in this view: first, catchers were feast or famine. If you didnt get one of the really good catchers (Posey, McCann, Mauer) in the first few rounds, you waited until the end of the draft to pick up anyone left. Second, no matter how good a reliever was, they werent going anywhere near the top of the draft, and once they started to come off the board, they all came off at the same time. With reliever, who knows what is what. Is Brandon Lyon really significantly better or worse than Chris Perez? Or Jose Valverde? Or any of these other losers who will most blow up your weekly ERA and WHIP by giving up 94 runs without recording an out at some point in the season, but will otherwise be reliably boring. For the most part, at the draft, one reliever is as good as the next. Finally, I was interested in the fall off of the middle and corner infield spots. For the corner, after people got their big hitting first baseman in the first few round, they werent so much interested in the corner with the percentage of those positions dropping precipitously for the rest of the draft. Similarly, once people got their middle infielder in the 5th-8th rounds, they stayed well away from those positions. It would seem that people are getting their utility by and large from the outfield spot which rose and fell, but was pretty even throughout the draft.
What was your draft strategy? Did you want to strategically take positions or just take the best player available and then fill in the rest of the roster as the draft went on making the best of the situation? Share it in the comments!
To follow shortly...............Draft Recap by Age! Also, Draft Recap by Salary with some subtle antisemistism! Graphs! Yeah!
Also, does anyone else want to write a post or two? Seek the acclaim of your league-mates, but receive only an empty comments zone! If you don't have ideas of your own, I can even furnish you with beautiful data! Email me!
Monday, March 28, 2011
Projections!
There was a time, once, when I looked at math as the enemy. I was in middle school, then, and I tried to be cool by disregarding all academics. The conic sections, though, kept whispering in my large ears promising order and reason like a siren from that classic epic story, Saving Silverman. "No!" I shouted like Mel Gibson, "I need a woman!" Math was relegated to the prefabricated shed of my mind and trotted out only to more easily calculate the time that it would take to replenish my supply of seminal fluid. Time passed, though, and I came to terms with my geekiness, and then it actually became cool to be smart in college. I now wield the sword of math, brandish the shield of statistics, and tap two forrests of Excel in all of my ventures from the quick calculation of tips perhaps to the fantasy that is, well, fantasy baseball.
Here are the projections for our league (with all transactions up to 3/28/11 taken into effect) this year. Rather than a simple roto calculation as was given to us during the draft, this calculation is a week-to-week H2H projection system based on a number of assumptions that you will probably argue with and then present no other way of calculation:
- All starters get 1 start per week
- All relievers get equal save chances each week (not equal to each other, but equal between weeks), those being the total number of games they are projected to appear in divided by 26 weeks. This averages out to a little more than 2 innings per week.
- All players will put up their calculated at bat average (calculated by their total projections over their projected at bats) every day of the week. In other words, no injuries. Enjoy Timmyboz.
- Each week is the same, there are no ups and downs.
These numbers represent the number of times that you will win a category against another team. So if you see a 6 below HRs, it means that you are projected to win the HR category in 6 of your 9 matchups.
Leading to the overall projections:
Here are the projections for our league (with all transactions up to 3/28/11 taken into effect) this year. Rather than a simple roto calculation as was given to us during the draft, this calculation is a week-to-week H2H projection system based on a number of assumptions that you will probably argue with and then present no other way of calculation:
- All starters get 1 start per week
- All relievers get equal save chances each week (not equal to each other, but equal between weeks), those being the total number of games they are projected to appear in divided by 26 weeks. This averages out to a little more than 2 innings per week.
- All players will put up their calculated at bat average (calculated by their total projections over their projected at bats) every day of the week. In other words, no injuries. Enjoy Timmyboz.
- Each week is the same, there are no ups and downs.
These numbers represent the number of times that you will win a category against another team. So if you see a 6 below HRs, it means that you are projected to win the HR category in 6 of your 9 matchups.
Leading to the overall projections:
Thursday, March 24, 2011
A Case Study in Value: Ben Zobrist
| Oh, hey there Ben. You look nice. I'll bet you are married to a Christian pop star. |
| Jose Bautista: Batting .350 when it comes to his fantasy. |
| Player | Runs | Home Runs | RBI | SB | BA | OPS | AB |
| A | 48 | 8 | 41 | 17 | 0.243 | 0.694 | 350 |
| B | 100 | 15 | 66 | 5 | 0.307 | 0.809 | 599 |
| C | 77 | 10 | 75 | 24 | 0.238 | 0.699 | 541 |
| D | 112 | 29 | 83 | 11 | 0.269 | 0.830 | 651 |
The lines that stick out in a positive way are B and C. They are players that among the league leaders in Runs and have strong numbers in other areas. B is Martin Prado and D is Rickie Weeks, both 2B-eligible. A is Jimmy Rollins and despite the reduced ABs and high steals, there is a lot of risk here. Sure, if he hits 13 HRs and steals 30 bases, he is valuable, but his downward trends and increasing injury problems are just not for me.
C is our boy, Ben Zobrist.
His numbers compare most favorably to Rollins here, though I doubt Rollins bats .238 over 500+ ABs. 70/10/70? If you are willing to forgo a few steals, there are plenty of second basemen who will give comparable numbers ten rounds later. On the other side of this argument, in 2009 Zobrist hit 27 long balls, went 90/90, stole 17 bases, and hit a hair below .300. These numbers would make him - as he was drafted last year - a fourth round pick, no question. In fact, those numbers are better than several OFs that I would always (and did) take higher than Zobrist. (See: Pence, Hunter) Curiouser and curiouser.
| Does anyone here know about Ben Zobrist's fantasy value? |
And yet, there is one more ripple when it comes to the value of Ben Zobrist: He is RF-eligible. Now, any respectable owner is saying, "But come on, why would I play him in an OF spot?" To that I say, "I agree." Well, I used to agree. Sure, if you are someone who sees the importance of leaving the draft with some strong middle infield picks but have none through round five, go for it, take Zobrist at 58. It is a bold pick, but not totally insane. After all, the reason we play is to say 'I told you so,' and Jimmy Rollins just isn't the savvy pick that Zobrist might be. Still, even sticking to simple numbers and value, there is reason to believe that this pick - Ben Zobrist at 58 as a starting 2B - is a risk that can help win a championship. But wait! Check this out: The Ben Zobrist owner, beyond conventional wisdom, IS penciling him in as an outfielder, instead filling his MI spots with Troy Tulowitzki, Ian Kinsler, and Rafael Furcal.
The water grows murkier. Value is confusing.
What will 2011 hold for Ben Zobrist owners? Come on, nobody really knows and that is the fun of the whole thing, but after all of my number crunching, statistical remodeling, and efforts to crack the value code, this draft strategy has opened my eyes. If Ben Zobrist is taken 58th overall in order to fill your 2B or 2B/SS spot, I see little reason to get excited. However, by owning four MI players and having a strong backup for an oft-injured Kinsler or Furcal, this owner has covered some of the risks of his players and strategy, all while depleting the 2B/SS pool, which was thin to begin with. This is a strategy that I admittedly do not have numbers to justify, nor do I have the stomach to attempt, but it is a crafty manipulation of the markets on positions and a unique demonstration of a fantasy owner's desire to produce numbers from every position.
Ben Zobrist, I am watching you...
...and your Christian pop-star wife:
Thursday, September 23, 2010
Draftees Remaining in Country
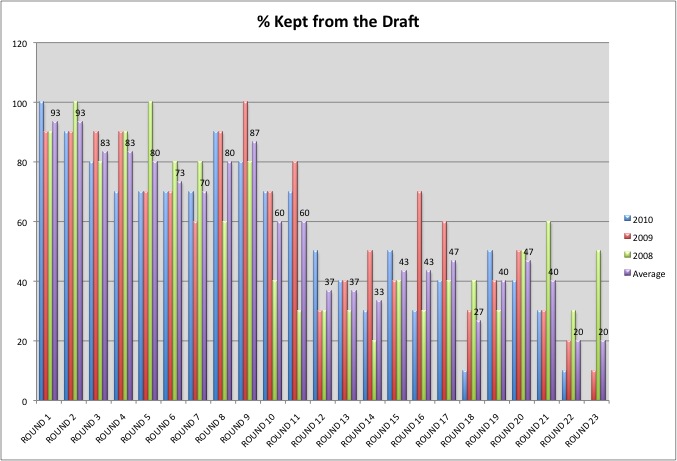
After round 11, you are more likely to drop a player that you draft than you are to keep him. Let's think about that for a second; there is a better chance that you will be wrong about how you rank more than half the players you draft. You have chosen a full dozen players before a player who will actually be valuable to you. That argument was incredibly flawed, but at least it wasn't a haiku, am I right here? Hey Now!
Also, note how, despite many players being dropped from the team to which they were drafted, a whole bunch of those were picked up and, at the end of the dayaloon, only about 32% of the rosters were populated by undrafted free agents. In other words, other people's garbage remains more appealing than plain old garbage. If it is good enough for someone else, it is good enough for me, as I always say. Also, I am not averse to eating garbage, as I also say, though less frequently.
| FA | Drafted Elsewhere | Drafted | ||
| Picture me Rollins | 4 | 6 | 14 | 24 |
| Omar's Coming | 8 | 6 | 10 | 24 |
| The Super Upton Brothers | 6 | 6 | 12 | 24 |
| It's a Trap! | 7 | 4 | 13 | 24 |
| Total Lack of Morales | 8 | 3 | 13 | 24 |
| Vaya Con Bernabe | 9 | 4 | 11 | 24 |
| Texas Fooey | 10 | 4 | 10 | 24 |
| Rockford Peachz | 7 | 5 | 12 | 24 |
| Ronnie Woo Woo | 10 | 2 | 12 | 24 |
| Omar's Spent | 8 | 0 | 16 | 24 |
Wednesday, August 11, 2010
Tuesday, July 20, 2010
Waiver Wire Awards
I have cracked the nut of the player transaction problem and have been able to draw some sweet gooey data out of it. With his data, I have managed to draw some players out as stand-out free agents who, for whatever reason, have distinguished themselves. Here they are! Let them be happy!
The Eternal Optimist Award
When players are dropped from their teams, they sometimes laugh it off and say, "I'll take my 3 days off and then stay up really late to see whose team I end up on when I get claimed off of waivers at 4:30 in the morning." 4:30 comes and goes, and the player still remains available. "Ain't no thing," he says, "Once the new week starts, I will make my way onto a good team and show them all how I do." The comforting twilight of Sunday gives way to the harsh fluorescent sun rising on Monday morning and still, the player remains available. Weeks pass and nothing happens; sure there may be a couple of interested teams looking at his stats, but surely there are better options available, maybe Julio Bourbon! Some players see this and decide to hang 'em up for the season, but others, those rare few, hold out hope that they will eventually be playing again on a fake major league team. And for a very few, their dreams come to fruition.
The winner of this first half season's eternal optimist, the player who has ridden the wire for the longest after being picked up and dropped, but then being picked up again is Chris Davis, the first baseman for the Texas Rangers. After being drafted by the commish in the 11th round, Davis was dropped on April 14th in favor of high-OPSer Nick Johnson. Davis languished on the waver wire for 87 days (and played in the minors) before being picked up again by the commish on July 10th over Russel Branyan. As well as Davis' optimism helped him in getting back to the show, he waited only a few days before he was dropped again in a trade involving Kung Fu Panda. Stay positive, Chris, maybe another team will take a chance on you.
Runner Up: Miguel Montero (Recovered from injury on the wire from 4/11 to 6/22, a layoff of 72 days)
Second Runner Up: Chris Coghlan (Roamed the wire from 4/14 until being picked up on 6/24, a layoff of 71 days)
The Channukah Award
Often, you pick up a player from the wire who is on a hot streak with the hope for a guy who will put up all star numbers for the whole season. Very rarely, this actually happens, but much more frequently, the player will keep the flame lit for a few weeks and then cool off. Some players inhabit the middle ground between these two extremes: they keep their flames lit for far longer than you dared to dream, but didn't have the gumption to stick around for the whole season.
The Channukah Award for the player who has been picked up and stuck around his team for the longest before being dropped again is Shawn Marcum, the pitcher for the Blue Kays. After going through surgery and missing the previous season, Marcum was great from the start and was picked up by the commish right at the beginning of the season on March 24. He managed to stay on the roster and contributing for 104 days before finally being dropped on July 6th for Madison Bumgardner. That stink must be strong, though, as he was picked up again shortly thereafter by the commish.
Runner Up: Juan Rivera (Picked up by Judd on 3/24 over Lastings Milledge and dropped on 6/28 for David Ortiz, a tenure of 96 days)
Second Runner Up: Dallas Braden (Picked up after pitching that perfecto game on 4/8 by Woo Woo over Aaron Harang and dropped on 6/21 for RA Dickey, a tenure of 74 days)
The Ugly Girl at the End of the Party Award
When one of your star players goes down and the time comes to search that waiver wire for a replacement, there seem to be a few players who are always there, just waiting to be picked up. They are never good enough to be on a team for a long time, but they are good enough to be picked up for a short time; they are better than nothing, after all.
There are 4 recipients of the Ugly Girl award, players who have been picked up and dropped the most times (involved in 6 transactions each). They are the always streaky David Ortiz, the potential all star youngster Buster Posey, the reliable former Yankee Austin Jackson, and the ugliest of closers who still has his job, Bobby Jenks.
The Rotating Door Jammer Award
The waiver wire is a harsh mistress. Often, when choo-choo-choosing a player, we throw common sense to the wind and pick up an player made of "old typewriter parts," who had been great before and could do it again, or a young player who has put up great minor league numbers and just may be able to carry it through to the majors. More often than not, players who are picked up are eventually dropped and their spot becomes a rotating spot for whoever is doing the best. Rare are the players who are picked up on the wire and remain there for the whole season.
The winner of the Rotating Door Jammer Award, the player who was picked up the earliest and remains on that team, is Casey McGehee who was picked up on April 2nd by Sabo and has held his spot in the roster since then.
Runner Up: Placedo Polanco and Vernon Wells (Tie), both picked up on April 5th by Ackbar and the commish, respectively.
Second Runner Up: Kelly Johnson, picked up on April 13th by Andrew.
Thursday, July 15, 2010
Why Carl Crawford is the Best Fantasy Player

As you can clearly see from this graphs, Carl Crawford is the one player who leads multiple unlinked quantitative scoring categories! I mean, look at how he is the one big exception to the rules in those graphs! Whereas his power peers are more chubby, like home plates, he is taller and more pointed, like an expecially angular shaped sperm shooting machine also known as a penis. Miguel Carbonara may lead in the power hitting categories, but as it turns out, because there are so few steals each week, each one is precious and actually worth more than a HR, of which there are more. I did many correlations of this that will not be shown here, but the benefits of hitting a whole bunch of HRs can be made up relatively easily by more plebian performance. Moreover, it turns out that one of the strongest categorical correlations is a negative one between HRs and SBs, meaning that most of the time, when you get a guy to swipe them bagaloons, he does so at the price of HRs. Carl, though, is able to hold up in both categories, meaning that not only do you get the speed upside, but you get no accompanying downside in power! Amazing!!!!!!!!!!!!
What's that? What methods did I use for this analysis you ask? No! You didn't ask! There is no you! There is only me. In an empty room. Alone with my beautiful numbers.
Thursday, June 17, 2010
State of the League
Look at that graph. Look at those 60% transparent baseballs in the background. Man (and Justine), that is a goddamn fine looking graph. So colorful. So easy to compare. So actually conclusion suggesting. Isn't it amazing how, after Oksana went to sleep before the Jacuzzi in weeks 6 and 7, the quantitative categories go down and the ERA and WHIP rise? And then fell in tandem with the rising other categories?
I feel sadness that the league was in such a slump in those weeks 6 and 7. I feel happiness that moves were made and the league is now as potent as it evar was. I feel pressure that the league is doing its best lately. I feel worried about how this week 15, where there will be a full week plus 4 post all star break days, will affect my statistical correlations. But then I look at that graph again and I feel happy.
Materials and Methods:
Team totals were tabulated and the averages of each category for the entire season was calculated. To calculate the individual weekly totals, a more complicated moving average was required to smooth out some of the noise in the data. Thus, for the meat of the weeks, the team averages were calculated by multiplying the team's performance in that given week by 4, the preceding and next weeks by 2, and the weeks surrounding that 3-week period by 1, and then dividing that by 10. For the first and last weeks, the same calculation was used except using 1-tail rather than 2 in the weekly tabulations. To construct the graph above, all data needed to be scaled so that it could be accurately compared (40HR can't be compared to 0.300 average in the same units). Thus, a variance-based approach was used where the weekly floating average was subtracted from the total average, and then divided by the total variation (the difference between the maximum weekly average and the minimum) to give values that range from 0.3704 (AVG in week 14) to -0.3198 (K/9 in week 7).
Tuesday, June 15, 2010
Worst Week Evar!
The commish recently noted in his power rankings that Sabo's team was coming off of a bad week, and to now focus on moving forward. This got me thinking about what the effects were of an especially bad week and how badly they hurt your team's overall record. My initial thinking was that it was most important to limit your damage on a bad hitting week by pitching well (and vice versa), and that to make up any sort of good ground in the overall rankings, you would need to make your great weeks count by taking 9, 10, or even 11 categories.
I went through the scores of each team in each week and quantified how good or bad each week was, and how the overall score of that week ended up (See Materials and Methods at the bottom of the post). I will highlight a few specific cases, but check out the original results, find your team, question the data!
1. The Peachz - Lemonade Makers
The Peachz have been frustratingly resilient throughout the years; you see their draft and laugh, you see some early pickups and you laugh, you see their record after the first go-round in the league and you laugh, and then somehow, the end up in the playoffs. Perhaps a look at how they performed in their best and worst weeks would give a clue:
Indeed, the Peachz were able to compensate for their bad hitting in week 4 against the Fooeys with dominant pitching to take the week 7-5, and they were able to outslug the Moraleseseseses in their worst pitching performance in week 1 and take advantage of the former Andruses' equally poor pitching to take the week 8-4. However, they were unable to convert their great power hitting numbers in week 9 against the Omars to more than an 8-4 victory, and did even worse when their usually dominant pitching was unable to outslug the Kurt Locker and were only able to eke out 7 victories.
What really stood out to me when looking over the Peachz records in these matchups was their consistency. Despite poor performances, the Peachz were able to add wins regardless of whether they were slugging and pitching at their best or were strug-gull-ling. In other words, the Peachz can win ugly or win pretty, but they consistently win, or at least don't ever drop an insane amount of games (except for this last week, where is Judd coming from?). Indeed, that is the key to their dominance in the league: they always manage to get just a few more victories than you do and scrape together wins in various categories each week even if they are unrelated. If you average 7 wins per contest, you will do quite well in the league.
2. The Bernabes - Follow the Guitar
If the overriding theme of the league and key to making the playoffs is to consistently win and inch your way into the bracket rather than win big occasionally and then lose the rest of the time, then the Vaya Con Bernabe team is the perfect and tragic illustration of what happens when you consistently lose and you fall farther and farther behind. The Bernabes are an excellent collection of players with some of the best pitching in the league, but they just don't have that locker room chemistry that carries teams over the top.
The Bernabes were not able to make up any ground with their ridiculous pitching when their hitting failed in week 8 against the Peachz, and they were unable to smash the ball when their pitching failed (but still won most categories) in week 5 against the Moraleseseseseses. However, even when they both hit the cover off the ball and pitched the best that they ever had in week 10, they were unable to make up any ground against the Upton Bros, falling to them 5-6-1. Looking at their weekly totals, it just seems like their great weeks don't match up with eachother: when they get the most RBIs, they can't score any runs; when they steal the most bases, they can't get any ding-a-lings. Even their vaunted pitching, so dominant, so many hitless and perfect innings, is unable to match up: with wins come high ERAs; where Ks are to be found, saves have run for ze hills. This team is a good team, they are just totally out of sync, which is causing them to drop games all over the place. Like the Peachz, who consistantly win and climb in those standings, the Bernabe are consistently losing and are thus falling farther and farther off pace.
3. The Complete Lack of Moraleses - All over the place
If the Peachz are climbing with consistent winning and the Bernabes are falling by losing the same way, the Moraleseseseses are all over the place. One week, they are losing 1-11, the next they are winning by the same score. Looking at how they have fared on their best and worst weeks, things become even more murky.
At their worst, they have dropped significant games. They dropped a total of 21 games against Omar and Ackbar when they hit and pitch poorly, respectively. Conversely, they took 8 and 8 against the Uptons and the Fooeys when they hit and pitched well. Currently, they sit second in the standings, and the majority of their games are nice 7 or 8 victories. They do, however, have these occasional but not rare major stumbles. Indeed, these types of wildly inconsistent performances have lead the Moraleses to hang with both the Matsuis and Bernabes in the basement, but also to hobnob with the Ackbars and Omar on the rooftop. How will this team play out? Will they be able to level out or will they just flame out and leave their crushing victories as little more than footnotes in a wasted season? We shall find out in about 10 weeks and, in the interim, all pray that we catch the Moraleses when they put their shoes on the wrong foot, rather than putting those shoes up your ass.
For most teams, the worst weeks come with about 4-5 wins, and the best come with 7-9 wins, but the common thread is that most of these performances are not the outliers; there are usually higher win totals when you perform worse, and lower win totals when you performed better. The key that I found when looking over all of these performances is the best single-week performances are rarely coming from the teams that are doing the best in the rankings; rather, the teams that are at the top are winning most of their matchups by small margins, but winning often. Just like the real sport of baseball and not this D&D version, teams that win 100 of their games 3-2 will end up going further than teams that win 60 of their games 15-0, but lose the remaining 100.
Materials and Methods - Each team's weekly scores were scored based on how they stood in the ranking of all of that team's scores. The best performances in a given category were given a +3 score, the second best a +2, and the third best a +1. The worst performances were given -3, -2, and -1 accordingly. All other scores were given a 0. The total hitting and pitching scores were tabulated (column AC "hitting" and AD "pitching" on the right in the "raw data" tab of the spreadsheet), and the best and worst performances for each team were isolated. Analysis was followed by coffee, and then I concluded on the pot.
I went through the scores of each team in each week and quantified how good or bad each week was, and how the overall score of that week ended up (See Materials and Methods at the bottom of the post). I will highlight a few specific cases, but check out the original results, find your team, question the data!
1. The Peachz - Lemonade Makers
The Peachz have been frustratingly resilient throughout the years; you see their draft and laugh, you see some early pickups and you laugh, you see their record after the first go-round in the league and you laugh, and then somehow, the end up in the playoffs. Perhaps a look at how they performed in their best and worst weeks would give a clue:
Indeed, the Peachz were able to compensate for their bad hitting in week 4 against the Fooeys with dominant pitching to take the week 7-5, and they were able to outslug the Moraleseseseses in their worst pitching performance in week 1 and take advantage of the former Andruses' equally poor pitching to take the week 8-4. However, they were unable to convert their great power hitting numbers in week 9 against the Omars to more than an 8-4 victory, and did even worse when their usually dominant pitching was unable to outslug the Kurt Locker and were only able to eke out 7 victories.
What really stood out to me when looking over the Peachz records in these matchups was their consistency. Despite poor performances, the Peachz were able to add wins regardless of whether they were slugging and pitching at their best or were strug-gull-ling. In other words, the Peachz can win ugly or win pretty, but they consistently win, or at least don't ever drop an insane amount of games (except for this last week, where is Judd coming from?). Indeed, that is the key to their dominance in the league: they always manage to get just a few more victories than you do and scrape together wins in various categories each week even if they are unrelated. If you average 7 wins per contest, you will do quite well in the league.
2. The Bernabes - Follow the Guitar
If the overriding theme of the league and key to making the playoffs is to consistently win and inch your way into the bracket rather than win big occasionally and then lose the rest of the time, then the Vaya Con Bernabe team is the perfect and tragic illustration of what happens when you consistently lose and you fall farther and farther behind. The Bernabes are an excellent collection of players with some of the best pitching in the league, but they just don't have that locker room chemistry that carries teams over the top.
The Bernabes were not able to make up any ground with their ridiculous pitching when their hitting failed in week 8 against the Peachz, and they were unable to smash the ball when their pitching failed (but still won most categories) in week 5 against the Moraleseseseseses. However, even when they both hit the cover off the ball and pitched the best that they ever had in week 10, they were unable to make up any ground against the Upton Bros, falling to them 5-6-1. Looking at their weekly totals, it just seems like their great weeks don't match up with eachother: when they get the most RBIs, they can't score any runs; when they steal the most bases, they can't get any ding-a-lings. Even their vaunted pitching, so dominant, so many hitless and perfect innings, is unable to match up: with wins come high ERAs; where Ks are to be found, saves have run for ze hills. This team is a good team, they are just totally out of sync, which is causing them to drop games all over the place. Like the Peachz, who consistantly win and climb in those standings, the Bernabe are consistently losing and are thus falling farther and farther off pace.
3. The Complete Lack of Moraleses - All over the place
If the Peachz are climbing with consistent winning and the Bernabes are falling by losing the same way, the Moraleseseseses are all over the place. One week, they are losing 1-11, the next they are winning by the same score. Looking at how they have fared on their best and worst weeks, things become even more murky.
At their worst, they have dropped significant games. They dropped a total of 21 games against Omar and Ackbar when they hit and pitch poorly, respectively. Conversely, they took 8 and 8 against the Uptons and the Fooeys when they hit and pitched well. Currently, they sit second in the standings, and the majority of their games are nice 7 or 8 victories. They do, however, have these occasional but not rare major stumbles. Indeed, these types of wildly inconsistent performances have lead the Moraleses to hang with both the Matsuis and Bernabes in the basement, but also to hobnob with the Ackbars and Omar on the rooftop. How will this team play out? Will they be able to level out or will they just flame out and leave their crushing victories as little more than footnotes in a wasted season? We shall find out in about 10 weeks and, in the interim, all pray that we catch the Moraleses when they put their shoes on the wrong foot, rather than putting those shoes up your ass.
For most teams, the worst weeks come with about 4-5 wins, and the best come with 7-9 wins, but the common thread is that most of these performances are not the outliers; there are usually higher win totals when you perform worse, and lower win totals when you performed better. The key that I found when looking over all of these performances is the best single-week performances are rarely coming from the teams that are doing the best in the rankings; rather, the teams that are at the top are winning most of their matchups by small margins, but winning often. Just like the real sport of baseball and not this D&D version, teams that win 100 of their games 3-2 will end up going further than teams that win 60 of their games 15-0, but lose the remaining 100.
Materials and Methods - Each team's weekly scores were scored based on how they stood in the ranking of all of that team's scores. The best performances in a given category were given a +3 score, the second best a +2, and the third best a +1. The worst performances were given -3, -2, and -1 accordingly. All other scores were given a 0. The total hitting and pitching scores were tabulated (column AC "hitting" and AD "pitching" on the right in the "raw data" tab of the spreadsheet), and the best and worst performances for each team were isolated. Analysis was followed by coffee, and then I concluded on the pot.
Wednesday, June 9, 2010
The 8-pitch limit
There has been much talk (well, some talk. Not as much as a David Wright gay post gets.) about the teams that go over the 8 start limit. I decided to look at this problem from a more statistical point of view and see what the real effects are of going over the start limit.
First, I simply wanted to see who committed this most foul of sins most often. There have been 22 instances where teams have gone over the start limit, and 16 times where one team has gone over while the other has stayed within the limits (3 matchups where both teams went over).
Sabo is weighing in as the most starts over the limit with 5 instances over the limit and 11 total starts over the limit. Sabo started 11 against me (as well as 11 against 1 other person, and 10 against 2 people), and I actually emailed him earlier in the week and he reveled in his limit-busting roster. As a lawyer, I think that Sabo goes with the idea that if the law allows it, it is legal, which I guess is sort of true. Loopholes are legal. Don't hate the playa, hate the game. I rest my case on your face, councilor. Good job Kurt Locker, Ackbar, and Andrus, you are going to fantasy baseball heaven.
It is all well and good for us to demonize the people who go over the limit, but was it really so bad to go over? To answer this question, I had to look more specifically at the effect of going over the limit. I went in with a number of assumptions:
- The more starts, the more Ks, and the people who went over the limit would be winning that category more often than losing it.
- Same with wins.
- Because you have so many more starters, you should not have as many closers and should thus be punting saves.
- Because you are throwing out more guys, the chances of you starting a crap pitcher or having a poor performance should go way up, so the ERA should be higher when you go over the start limit.
- Same with WHIP.
- Same with K/9.
I looked at how many times a team that has gone over the start limit has taken a category when their opponent has stayed within the limit. The results were not what I was expecting.
First of all, the way that I read these results is that the extra starts would be said to have an effect on a given category if there was a significant shift away from 50% wins, 50% losses. If half the time you won and half the time you lost a given category when doing something, it makes sense that that something would really not have an effect on how well you do in that category.
So as you can see, when you went over the limit and your opponent did not, you won or tied Ks and Wins much more often than you lost (75 and 68.5%, respectively), meaning that the extra starts definitely strongly affected these two categories. However, these extra wins did not seem to come at any cost, as I had initially predicted. Teams that trotted out all of these extra starters did not sacrifice any of their relief efforts, and the ERA and WHIP remained steady in the face of so many extra innings pitched.
So it seemed like Ks and Wins were the only category that were responsive to these extra starts. To confirm this, I normalized these categories and saw what the effects were. I thought it unfair to simply cut out the best performance or the last pitching performance of the week, so I simply found what the average start of the week was for these teams and averaged them over 8 starts. As expected, Ks and Wins fell into more randomized ratios, where teams won half their games.
Indeed, had these people followed the rules as they were, they would have given up a bunch of wins.
All of this got me thinking about the effect of extra starts. Indeed, it seems like if you start more guys, you get better results. However, if you stay under the 8 start limit, is there anything wrong with that?
Apparently, the winning strategy is just to load up on starting pitching. The more starters that you trot on out there, the greater the chance of you winning those critical quantitative pitching categories, and seemingly, there is no detriment to the average pitching categories. Indeed, it is questionable whether having extra bench hitters to fill in on those Mondays and Thursdays will have nearly the benefit of having an extra starter, regardless of quality. Even if you say that more starters means less quality, you will still be able to rack up those innings and absorb a bad pitching outing more easily than if you had pitched fewer innings.
One of the interesting conclusions that I came to when looking at this data was that these extra starts are often accumulated at the ends of the weeks, after you already know what your pitching line will look like. If you had stunk up the joint and your WHIP and ERA is already raising the roof, and not in a good way, or that your opponent's is, then it is very easy to push those starters out there to get Ks and Wins without worrying too much about their actual performance. I think that we have all been in the odd position when you are happier to have a guy hit a homer than to ground out, simply because you already have sealed up that category.
In the end, I agree with the decision made by the commish and support further the notion that we should just drop all upper pitching limits. We always make the decision of whether the extra Ks or Wins will be worth the chance of giving up a million more runs, the only crux is that at the end of the week, these averages all set up and the team that is ahead in ERA and WHIP has much more to risk by sacrificing one precious move, a player who they probably wanted to keep, and the sanctity of those low average categories for the marginal benefit of beating your opponent in those two critical quantitative categories. We may think that it is cheap for a guy who has a 6 ERA and a 2 WHIP on Saturday to pick up a bunch more guys to win Ks and Wins, but it is in fact the same calculated risk we all make except for the fact that a bad outing will not be nearly as detrimental. Hindsight is 20-20, and most of these decisions are made on the cost-benefit analysis that we all run before the starts. It seems like you simply have to make the decision that we all knew intrinsically, that you will be getting a few extra Ks and possibly a win, but you are running the risk of a bad outing.
First, I simply wanted to see who committed this most foul of sins most often. There have been 22 instances where teams have gone over the start limit, and 16 times where one team has gone over while the other has stayed within the limits (3 matchups where both teams went over).
Sabo is weighing in as the most starts over the limit with 5 instances over the limit and 11 total starts over the limit. Sabo started 11 against me (as well as 11 against 1 other person, and 10 against 2 people), and I actually emailed him earlier in the week and he reveled in his limit-busting roster. As a lawyer, I think that Sabo goes with the idea that if the law allows it, it is legal, which I guess is sort of true. Loopholes are legal. Don't hate the playa, hate the game. I rest my case on your face, councilor. Good job Kurt Locker, Ackbar, and Andrus, you are going to fantasy baseball heaven.
It is all well and good for us to demonize the people who go over the limit, but was it really so bad to go over? To answer this question, I had to look more specifically at the effect of going over the limit. I went in with a number of assumptions:
- The more starts, the more Ks, and the people who went over the limit would be winning that category more often than losing it.
- Same with wins.
- Because you have so many more starters, you should not have as many closers and should thus be punting saves.
- Because you are throwing out more guys, the chances of you starting a crap pitcher or having a poor performance should go way up, so the ERA should be higher when you go over the start limit.
- Same with WHIP.
- Same with K/9.
I looked at how many times a team that has gone over the start limit has taken a category when their opponent has stayed within the limit. The results were not what I was expecting.
First of all, the way that I read these results is that the extra starts would be said to have an effect on a given category if there was a significant shift away from 50% wins, 50% losses. If half the time you won and half the time you lost a given category when doing something, it makes sense that that something would really not have an effect on how well you do in that category.
So as you can see, when you went over the limit and your opponent did not, you won or tied Ks and Wins much more often than you lost (75 and 68.5%, respectively), meaning that the extra starts definitely strongly affected these two categories. However, these extra wins did not seem to come at any cost, as I had initially predicted. Teams that trotted out all of these extra starters did not sacrifice any of their relief efforts, and the ERA and WHIP remained steady in the face of so many extra innings pitched.
So it seemed like Ks and Wins were the only category that were responsive to these extra starts. To confirm this, I normalized these categories and saw what the effects were. I thought it unfair to simply cut out the best performance or the last pitching performance of the week, so I simply found what the average start of the week was for these teams and averaged them over 8 starts. As expected, Ks and Wins fell into more randomized ratios, where teams won half their games.
Indeed, had these people followed the rules as they were, they would have given up a bunch of wins.
All of this got me thinking about the effect of extra starts. Indeed, it seems like if you start more guys, you get better results. However, if you stay under the 8 start limit, is there anything wrong with that?
Apparently, the winning strategy is just to load up on starting pitching. The more starters that you trot on out there, the greater the chance of you winning those critical quantitative pitching categories, and seemingly, there is no detriment to the average pitching categories. Indeed, it is questionable whether having extra bench hitters to fill in on those Mondays and Thursdays will have nearly the benefit of having an extra starter, regardless of quality. Even if you say that more starters means less quality, you will still be able to rack up those innings and absorb a bad pitching outing more easily than if you had pitched fewer innings.
One of the interesting conclusions that I came to when looking at this data was that these extra starts are often accumulated at the ends of the weeks, after you already know what your pitching line will look like. If you had stunk up the joint and your WHIP and ERA is already raising the roof, and not in a good way, or that your opponent's is, then it is very easy to push those starters out there to get Ks and Wins without worrying too much about their actual performance. I think that we have all been in the odd position when you are happier to have a guy hit a homer than to ground out, simply because you already have sealed up that category.
In the end, I agree with the decision made by the commish and support further the notion that we should just drop all upper pitching limits. We always make the decision of whether the extra Ks or Wins will be worth the chance of giving up a million more runs, the only crux is that at the end of the week, these averages all set up and the team that is ahead in ERA and WHIP has much more to risk by sacrificing one precious move, a player who they probably wanted to keep, and the sanctity of those low average categories for the marginal benefit of beating your opponent in those two critical quantitative categories. We may think that it is cheap for a guy who has a 6 ERA and a 2 WHIP on Saturday to pick up a bunch more guys to win Ks and Wins, but it is in fact the same calculated risk we all make except for the fact that a bad outing will not be nearly as detrimental. Hindsight is 20-20, and most of these decisions are made on the cost-benefit analysis that we all run before the starts. It seems like you simply have to make the decision that we all knew intrinsically, that you will be getting a few extra Ks and possibly a win, but you are running the risk of a bad outing.
Subscribe to:
Posts (Atom)